Kmeans python 구현
케이민즈(Kmeans) 파이썬 알고리즘 소개
K-means Clustering (k-평균)은 주어진 데이터에 대해서 주어진 k개의 클러스터로 그룹화 시켜주는 알고리즘입니다.
데이터들의 거리를 계산하여 거리 차이를 최소화 하여 클러스터의 위치를 조절하는 방식이며 python을 이용하여 구현하였습니다.
데이터 분석에서 클러스터를 활용한 그룹화 방식이 많이 이용되는데 kmean은 많이 사용되고 있는 알고리즘 중에 하나 입니다.
import pandas as pd
import matplotlib
import matplotlib.pyplot as plt
from mpl_toolkits.mplot3d import Axes3D
import matplotlib.colors as mcolors
from matplotlib import style
import numpy as np
import random
파이썬의 라이브러리들을 불러옵니다.
3차원에서 그려주기 위해서 Axes3D도 불러옵니다.
kmean 함수
def kmean(n, k):
    d = n.shape[1]
    c = np.random.choice(range(len(n)),k)
    c = n[c].astype('float32')
    print(c)
    init = True
    while init == True:
        cluster = np.zeros((len(n),k))

        for i in range(len(n)):
            temp = np.zeros((k))

            for j in range(k):
                g_temp = 0
                for g in range(d):
                    g_temp += (c[j][g] - n[i][g])**2

                temp[j] = g_temp**0.5


            cluster[i][np.argmin(temp)] = 1

        cnt = 0
        for p in range(k):

            clu_index = np.where(cluster[:,p]==1)
            clu_vec = n[clu_index]
            k_to_c = np.sum(clu_vec,axis=0)/len(clu_vec)
            point_c = 0
            for g in range(d):
                point_c += (c[p][g] - k_to_c[g])**2

            if point_c**0.5 < 3:
                cnt += 1
                if cnt == k:
                    init = False
                    break

            c[p] = k_to_c
    print(c)
    return cluster, c
위는 kmean의 함수부로 동작 방식은 정해진 k개의 클러스터만큼의 랜덤 포인트를 데이터에서 가져온뒤 데이터들과의 거리를 계산하여 데이터의 그룹을 정해줍니다.
정해진 그룹에서 클러스터의 위치를 수정하기 위해서 그룹의 좌표를 벡터로 계산하여 중심으로 클러스터의 위치를 수정해줍니다.
sample data 생성
x = np.random.choice(range(1,1001),100).reshape(-1,1)
y = np.random.choice(range(1,1001),100).reshape(-1,1)
z = np.random.choice(range(1,1001),100).reshape(-1,1)
그룹화 하기 위한 sample데이터를 생성해줍니다. 데이터의 범위는 1~1000까지로 설정하였습니다.
data = np.hstack((x,y,z)) #3D-data
#data = np.hstack((x,y)) #2D-data

fig = plt.figure()
ax = fig.gca(projection='3d')
if data.shape[1] == 3:
    ax.scatter(data[:,0],data[:,1],data[:,2],c='lightgray',marker='o', s= 50)
else:
    ax.scatter(data[:,0],data[:,1],c='lightgray',marker='o', s= 50)
plt.grid(True)
plt.show()
생성한 샘플데이터를 묶어준뒤에 3차원에 그려서 데이터의 분포를 확인해 줍니다.
아래와 같이 3차원에 생성된 데이터의 분포를 확인할 수 있습니다.

kmean 함수 실행
clu, c = kmean(data,3)
생성된 데이터와 클러스터 수(k)를 파라미터로 하여 kmean함수를 실행하여 줍니다.
리턴값으로는 clu(데이터의 그룹), c(클러스터 위치)를 받습니다.
kmean 실행결과 (함수내부 print)
[[ 24. 995. 569.]
 [673. 317. 627.]
 [880. 937. 544.]]

[[167.81818 761.3182  641.5455 ]
 [503.62222 209.2889  487.53333]
 [713.51514 727.0909  331.     ]]
위에 있는 리스트는 처음 선택된 클러스터 포인트이며 두번째에 있는 리스트는 그 이후에 위치가 조정되면서 변화된 클러스터의 최종 포인트 위치입니다.
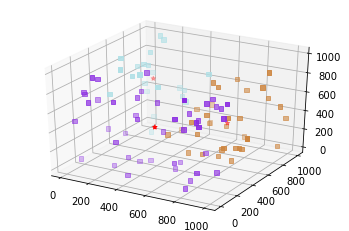
결과 출력
fig = plt.figure()
ax = fig.gca(projection='3d')
color = random.sample(list(mcolors.CSS4_COLORS.values()), len(c))
print(color)
for i in range(len(c)):
    if data.shape[1] == 3:
        ax.scatter(data[np.where(clu[:,i]==1)][:,0],data[np.where(clu[:,i]==1)][:,1],data[np.where(clu[:,i]==1)][:,2], c = color[i],marker='s')
    else:
        ax.scatter(data[np.where(clu[:,i]==1)][:,0],data[np.where(clu[:,i]==1)][:,1], c = color[i],marker='s')

if data.shape[1] == 3:
    ax.scatter(c[:,0],c[:,1],c[:,2],c='red',marker='*')
else:
    ax.scatter(c[:,0],c[:,1],c='red',marker='*')

plt.show()
각 클러스터 그룹 마다 컬러를 다르게 해주기 위해 matplot에 있는 css컬러 리스트에서 클러스터의 수 만큼 색을 가져와서 그룹별로 그래프에 출력해주고 클러스터 포인트의 위치는 빨간색 *모양으로 해주었습니다.
kmeans algorithm은 데이터 분석이나 머신러닝, 딥러닝을 하기위해서 많이 사용됩니다. kmean은 빠르고 강력한 클러스트링 분석방법중 하나이지만 단점으로 클러스터의 수를 직접 설정해 주어야 하며 또한 PCA 등과 같은 차원축소가 선행되야하는 등의 문제가 있습니다.
'Data Analysis > Algorithm' 카테고리의 다른 글
| KNN python 알고리즘 simple 구현 (0) | 2020.02.04 |
|---|